This web page was produced as an assignment for Genetics 564 at UW-Madison Spring 2015.
What is a protein?
If genes are the instruction manual for life, then proteins are the tools used. The formation of proteins follows the a process called the central dogma where DNA is transcribed to RNA which is translated to proteins by coordination molecular machinery. The Tbx1 protein is thought to be a transcription factor, or a protein that plays a role in regulating reading of specific genes, and is required for normal development. In 22q11.2 DS, one copy of the Tbx1 is gone thus there is less Tbx1 present in cells to mediate other genes. This is called haploinsuffiency and has been associated with causing a majority of the symptoms and potential lethality of 22q11.2 DS (1,2).
HOMOLOGY
What is homology?
|
Homology can be described as similarities between species due to the evolution from a common ancestor. Homologous structures basically look similar on the inside, but no longer have the same function or look the same on the outside between species. A great example of this can be seen by looking a the forelimb of different species. In figure 1, the structure of the limb remains constant even though it is well observed that a whale's flipper is used for swimming where as a bat's wing is used for flight (3). This can also be applied when looking at the structure and function of genes and proteins between species.
|
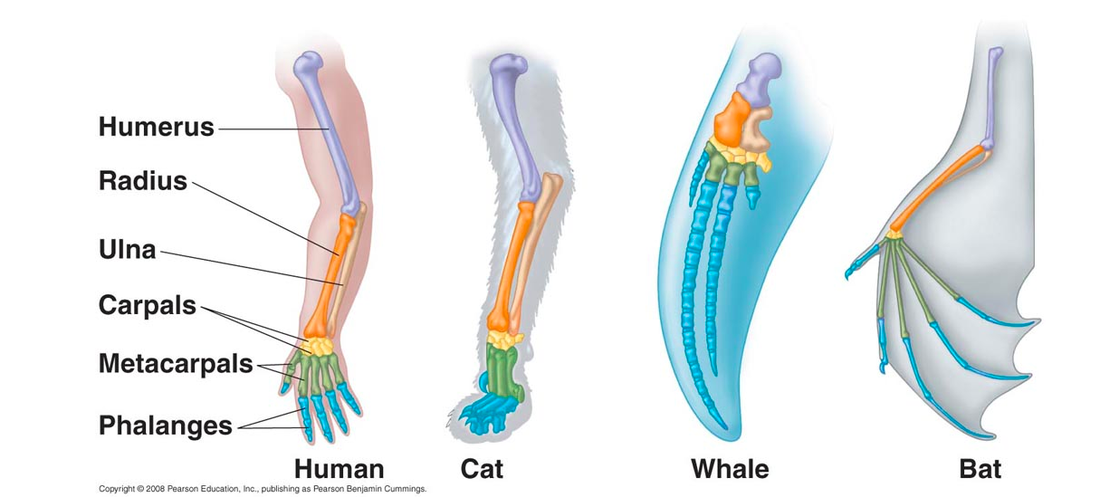
Figure 1: Homology of the forelimb
|
Homology of the Tbx1 protein
To find the homology of the Tbx1 protein, I first obtained the the gene accession number using ENTREZ by searching in the Nucleotide database that includes all DNA and RNA sequences and then filtered by RefSeq. By clicking on the GenBank tab, the human accession number was obtained first (NP_542378.1). The Tbx1 protein has three known and two predicted variants. I chose to precede with variant C due to findings in the literature. This finding was confirmed by using OMIM and UNIPROT. The UNIPROT number was also obtains (O43435). By using the human accession number, I was able to identify all of the homologs for Tbx1 by using BLAST and then aligning two sequences. This was also confirmed by using Homologene. Results are shown below in figure 3. Percent identity, or how much of the homologous sequence exactly matches the original, and E-value was noted. All E-values were close to zero meaning that findings are statically significant. A reciprocal BLAST was done to verify the findings by comparing the homologous organisms to the human Tbx1 gene. Model organisms, such as mouse and zebrafish, were looked at first then other interesting findings were noted.
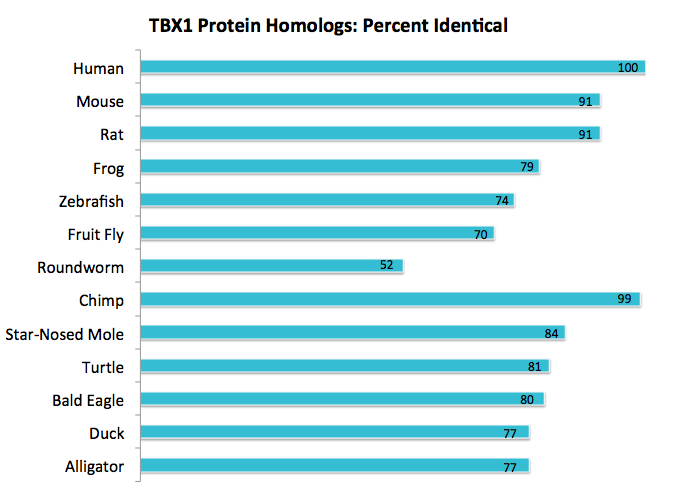
Figure 2: Human TBX1 protein compared to some of its homologs. All model organisms are listed first followed by other interesting findings.
Analysis
The Tbx1 protein was found to be homologous in bilateria, or organisms with a front and back along with left and right sides, and remained fairly conserved in percent identity. This provides evidence that Tbx1 is essential for life. From earlier, I mentioned that Tbx1 is involved the formation of the heart and face. As seen in figure 3, I chose a wide variety of species to demonstrate how Tbx1 is working dynamically with other proteins to form a diverse range of facial structures. For example, the beak of an eagle is structurally different to a snout of an alligator, but yet they both contain similar Tbx1 amino acid sequences.
Homology Protein References:
Human (Homo Sapiens)
Accession Number: NP_542378.1
T-box transcription factor TBX1 isoform C
495 aa
FASTA
Uniport Number: O43435
Accession Number: NP_542378.1
T-box transcription factor TBX1 isoform C
495 aa
FASTA
Uniport Number: O43435
Model Organisms:House Mouse (Mus musculus)
T-box transcription factor TBX1 Accession Number: NP_035662.1 Max Identical: 91% E-Value: 0.0 FASTA |
Brown Rat (Rattus norvegicus)
T-box transcription factor TBX1 Accession Number: NP_001101792.1 Max Identical: 91% E-Value: 0.0 FASTA |
Roundworm (Caenorhabditis elegans)
Protein MLS-1 Accession Number: NP_498640.1 Max Identical: 52% E-Value: 8e-72 FASTA |
|
Fruit Fly (Drosophila melanogaster)
optomotor-blind-related-gene-1, isoform A Accession Number: NP_511085.2 Max Identical: 70% E-Value: 4e-100 FASTA Other: |
Zebra Fish (Danio rerio)
T-box transcription factor TBX1 Accession Number: NP_899182.1 Max Identical: 74% E-Value: 0.0 FASTA |
Western Clawed Frog (Xenopus tropicalis)
T-box transcription factor TBX1-A Accession Number: NP_001030290.1 Max Identical: 79% E-Value: 0.0 FASTA |
|
American Alligator (Alligator mississippiensis)
T-box transcription factor TBX1 Accession Number: XP_006270988 Max Identical: 77% E-Value: 0.0 FASTA |
Bald Eagle (Haliaeetus leucocephalus)
T-box transcription factor TBX1 Accession Number: XP_010580052 Max Identical: 80% E-Value: 0.0 FASTA |
Common Chimpanzee (Pan troglodytes)
T-box transcription factor TBX1 Accession Number: XP_009436070.1 Max Identical: 99% E-Value: 0.0 FASTA |
|
Chinese softshell turtle (Pelodiscus sinensis)
Accession Number: XP_006119748.1 Max Identical: 81% E-Value: 6e-149 FASTA |
Duck (Anas platyrhynchos)
Accession Number: EOA97824.1 Max Identical: 77% E-Value: 9e-112 FASTA |
Star-Nosed Mole (Condylura cristata)
T-box transcription factor TBX1 Accession Number: XP_004694992 Max Identical: 84% E-Value: 0.0 FASTA |
PHYLOGENY
What is phylogeny?
Since the rise of DNA sequencing, phylogeny can tells us how closely related different species are. This can be studied by looking at the alignments of DNA or protein sequences of homologous genes to determine how many changes in the sequences there are. These changes, or mutations, can determine how long ago species diverged from the most common ancestor, as in, a species that diverged a longer time ago will have accumulated more mutations thus the sequences would look more different and will not align as closely (4).
Phylogeny of Tbx1
In order to understand phylogenetic results, it must be made clear how to make phylogenetic trees. First, you need to collect and formate the FASTA (amino acid sequences) from the homologous proteins you want to analyze. You can see the FASTA information I used for the phylogenic analysis of Tbx1 is listed below. Next, the amino acid sequences are aligned. Multiple sequences can be aligned by using a computer program which try to maximize the number of amino acid matches (4). For this analysis, I used Clustal Omega and figure 4 shows the alignment of a portion of the Tbx1 protein.
| protein_homologs_fasta.docx |
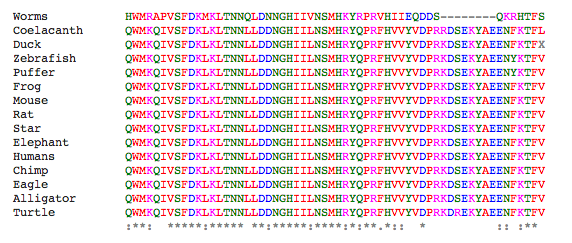
Figure 4: Portion of the alignment for the TBX1 protein. Note how highly conserved this protein is across all species examined.
Then, before generating the trees, alignments must be compared, or scored, using either the BLOSUM Matrix or percent identity (PID). The BLOSUM Matrix compares two sequences and assigns a predetermined value to each amino acid pair (5). PID scoring is based off of the same amino acid being present in both sequences at the same location, in other words, it looks if the sequences are the same or not at each location along the protein sequence (5).
Using these alignment scoring methods, two types of trees can be generated, Neighbor Joining and Average Distance. Neighbor Joining generates tress with the shortest possible branch lengths, where as, Average Distance looks at the lowest average dissimilarity between sequences to determine clusters and branch lengths (6).
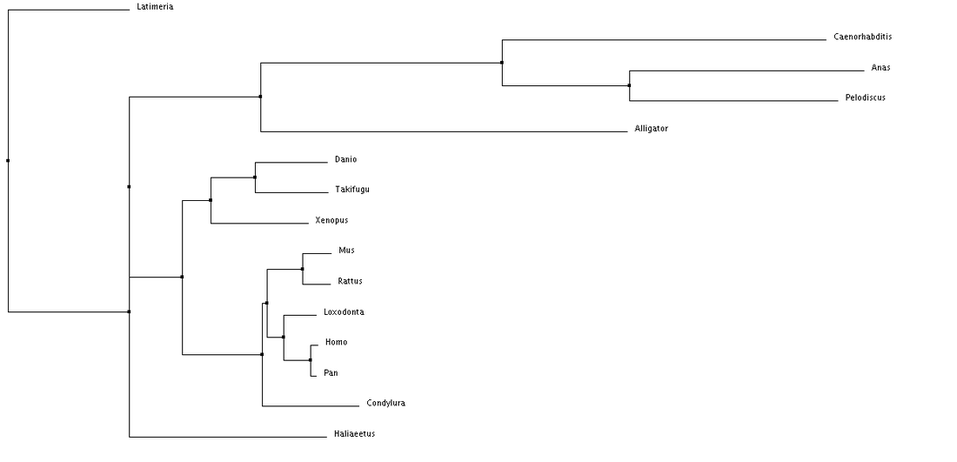
Figure 5: Neighbor Joining method using BLOSUM62 Matrix
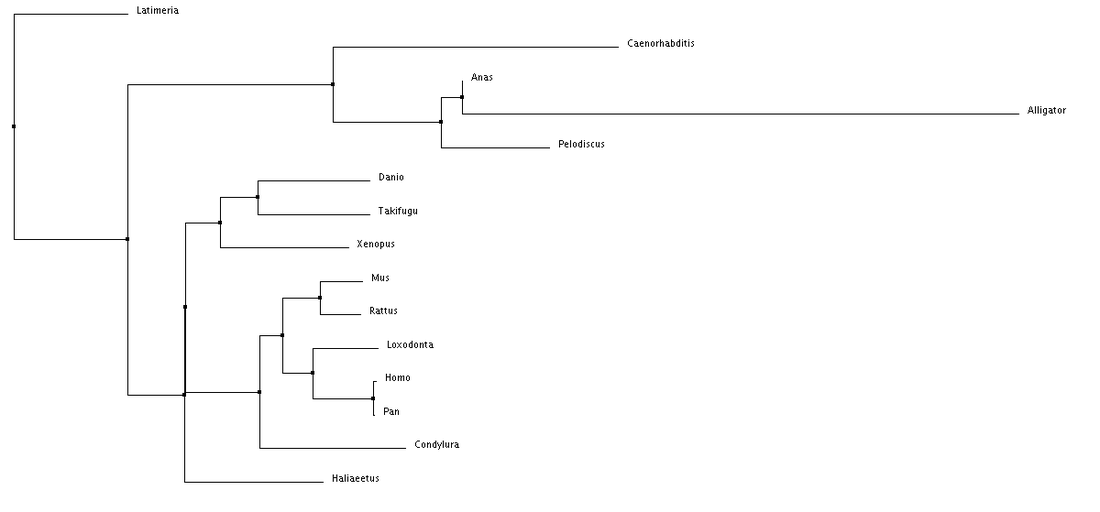
Figure 6: Neighbor Joining method using PID
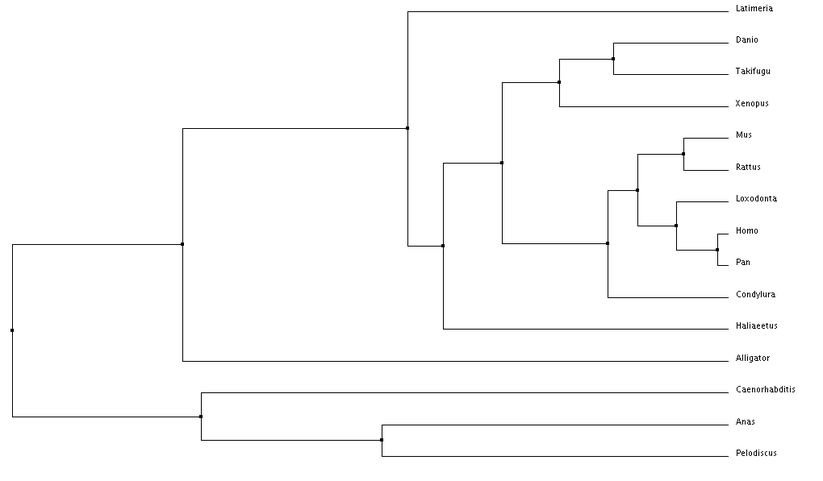
Figure 7: Average Distance method using BLOSUM62
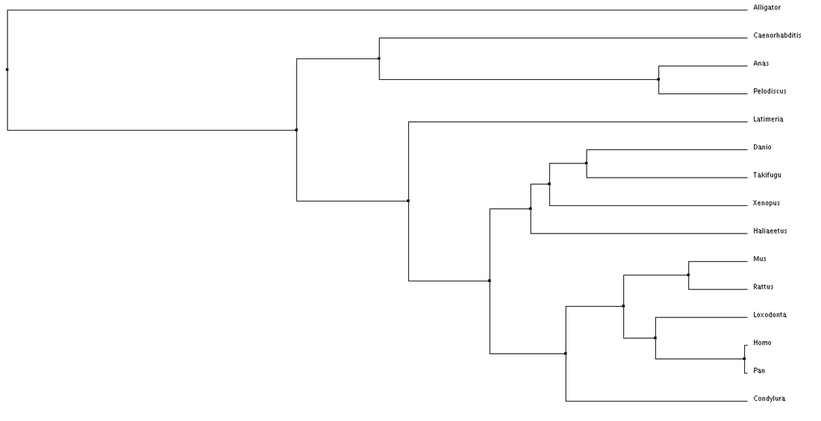
Figure 8: Average Distance method using PID
Analysis
Overall, nothing really looks out of place when examining these phylogenetic trees. The species are separated fairly distinctly by class (mammila, aves, reptilia, etc.). I am also seeing the species separated by their facial features. An example of this is comparing a chimp to a human, there facial features are fairly similar, while the duck and turtle are in a different cluster and have different distinct facial features. This makes me wonder about how subtle changes in Tbx1 sequence can alter its function or it interacts with other proteins during development.
DOMAINS
What is a domain?
A protein domain is unit of a protein that usually represents a function or structural component that reflects a proteins overall biological role (7). Tbx1 is part of a superfamily of genes that contains the T Box domain. The T Box domain is associated with transcriptions factors that are important to embryonic development (2). I used SMART and Pfam to determine to study the domains of Tbx1.
Tbx1 findings
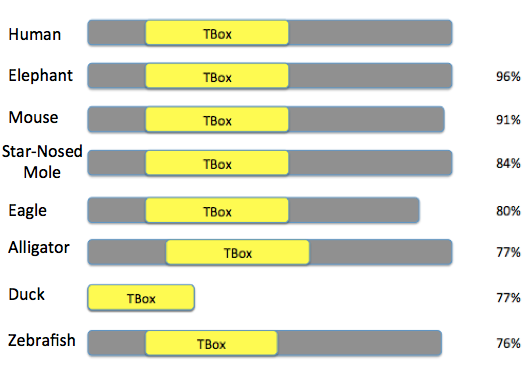
Figure 9: The Tbx1 protein contain one domain, the Tbox that can be seen across different species. Percent identity to the human homolog is noted on the right hand side.
Analysis
Like the Tbx1 gene, the T Box domain is highly conserved in length and location across different species. This shows again that Tbx1 and the T Box domain is essential for life and normal embryonic development and must be playing a critical molecular role. Once again, I decided to look specifically at species whose faces look very different from humans. This brings up the same questions I had earlier in the phylogeny section about how small changes in sequence can add up to large structural differences. A small change, for example, could be the a single nucleotide change that leads to a phosphorylation.
MOTIFS
What is a motif?
A DNA motif is a short pattern in a sequence that has been associated with a biological function (8). Studying motifs can give further information about regulatory elements, RNA processing, or translation of a gene (8). I used MEME, a motif database, to identify any repeat elements in the Tbx1 gene. GOMo was then used to identified the suggested biological role of the motifs (figure 10) (9) . The same process was done with Tbx1 protein sequence (figures 11-12) (10).
TBX1 findings
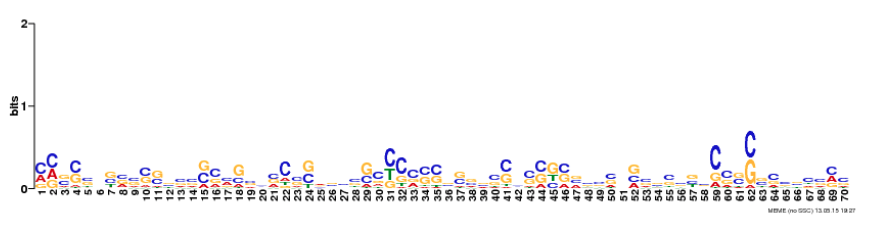
Figure 10: One DNA motif was identified using GOMo
|
Predicted Biological Function of DNA Motif via GOMoBiological Process: Negative regulation of signal transduction
Molecular Function: ATP binding Cellular Component: Transcription factor complex, cytosol, and extrinsic to membrane |
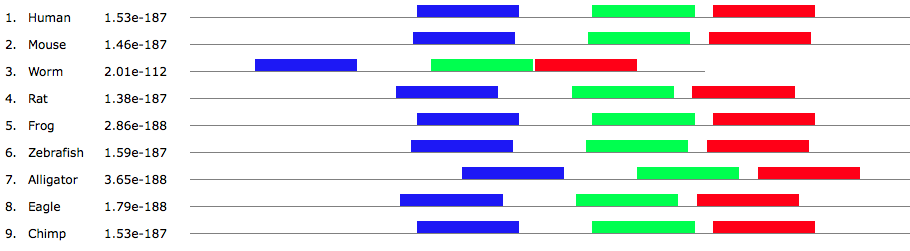
Figure 11: The Tbox domain consistantly contains 3 protein motifs across multiple species. Motif 1 (red) Motif 2 (green) Motif 3 (blue)
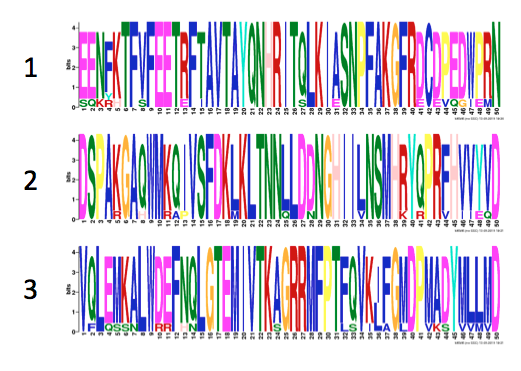
Figure 12: Sequences of the 3 TBox Motifs. Large, single letters represent conserved amnio acids across all examined species.
Analysis
The three motifs shown in Figure 11 are located within the T Box domain. From the domain sections above, it was observed that the T Box domain is highly conserved across species. The motifs are also highly conserved. All three motifs are present in the observed species suggesting that the motifs are important to the function of the T Box. Taking into account the expectations of a transcription factor, these motifs could be playing a role in specific DNA sequence binding or protein dimerization. This is supported by the GO terms identified by GOMo (Figure 10).
PROTEIN INTERACTIONS
What is an interaction network?
Interaction networks are visual representations of multiple proteins interacting in a specific way within a cell. STRING, a protein interaction database, is a collection of known and predicted interactions gathered from genomic context, highthroughput experiments, conserved coexpression, and previous knowledge (12). Connections on STRING can be shown either by confidence (represented by line thickness), evidence, or actions (activation, binding, etc).
The protein interactions for Tbx1 were found by using STRING. Proteins were then sorted by molecular function using UNIPROT.
The protein interactions for Tbx1 were found by using STRING. Proteins were then sorted by molecular function using UNIPROT.
Tbx1 findings
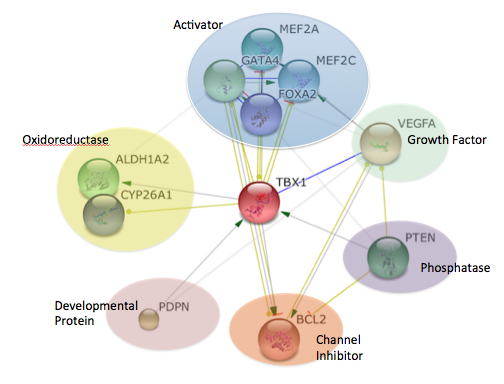
Figure 13: Human Tbx1 protein interaction network.
The yellow lines represent expression, blue represents binding, and the greens arrows represent activation.
Analysis
Tbx1 was found to interact with a wide variety of proteins. This gives insight to how Tbx1 is involved in so many biological processes along with shedding light on the importance of Tbx1 as a regulatory protein. For example, the proteins involved in oxidoreductase show the less known role of Tbx1 in metabolism. It is also not surprising that Tbx1, a transcription factor, is controlling the expression of other transcriptional activators. I found it interesting that Tbx1 is being activated by protein phosphatase PTEN and developmental protein PDPN. The interaction between protein phosphatases and Tbx1 will be classified further in my specific aims.
PROTEOMICS
What is the proteome?
|
The proteome is all the proteins in an organism. The study of the proteome is called proteomics which looks at the expression, structure, and interactions of the proteins. Proteomic analysis can be to compare healthy verse disease states by using mass-spectrometry to measure relative abundance, modification, and interactions (13). Figure 14 highlights the complexity and connectivity of the proteome.
|
Figure 14: Yeast Proteome
|
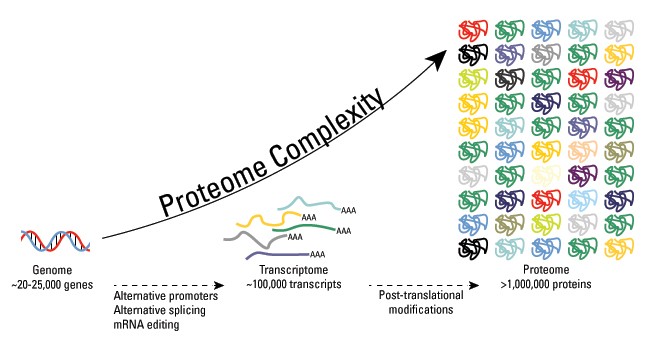
Figure 15: Demonstration of how post translational modifications increase the variability and complexity of the proteome.
|
What are post translational modification?Variation in protein structural and function, even those with the same sequence, are due to post translational modifications. These modifications are small molecular that are added to the an existing protein that help to determine the role of the protein. Post translational modifications are important in most cellular processes, like cell signaling and differentiation (14). One post translational modification that will be looked at in depth below is phosphorylation. Phosphorylation is the addition of a phosphate group to a serine, threonine, or tyrosine, and plays a role in regulating protein function (14).
|
Tbx1 findings
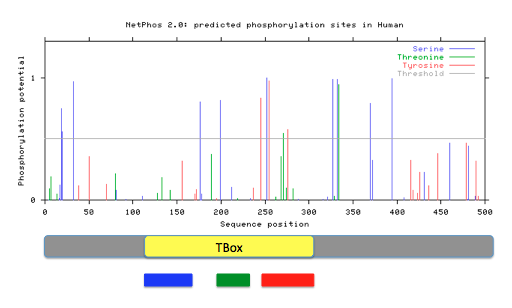
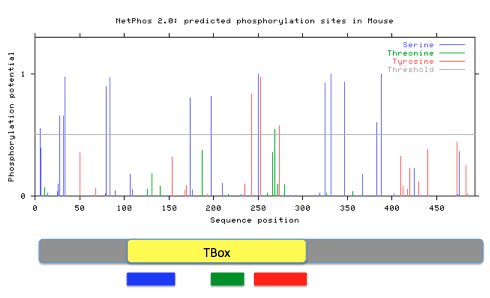
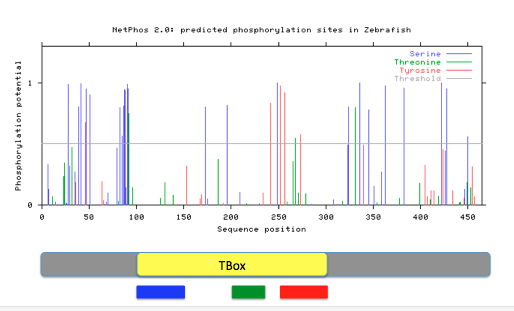
Phosphorylation sites for Tbx1were predicted using NetPhos2.0 by entering the FASTA formatted Tbx1 protein sequences. Prediction with a score greater than 0.5 and within the Tbox domain were noted. Protein motif locations from MEME were also compared against phosphorylation patterns.
|
|
Figure 16: Predicted phosphorylation patterns via NetPhos for humans, mice, and zebrafish. Below each readout, diagrams of the Tbx1 gene containing the Tbox domain and motifs 1(red), 2 (green), and 3 (blue) are aligned.
Analysis
Phosphorylation patterns appear to remain conserved across species. Most phosphorylation is occurring in motifs 1 and 2 that potentially could give insight to the role those motifs inside the cell. They possibility could be regulated by the presence or absence of the phosphate group at a given time. Specific sites stand out to me as more important to the function of Tbx1 and the Tbox domain because of high conservation across many species and a confident score given by NetPhos. These sites are the serines at human amino acids 199 and 252, the threonine at 271, and the tyrosine at 276. In my aims, I will look further into the importance of these specific phosphorylation sites and how they interact with protein phosphatases, such as PTEN.
References:
1. UNIPROT. http://www.uniprot.org/uniprot/O43435. Accessed March 23, 2015.
2. Genetics Home Reference (2015). http://ghr.nlm.nih.gov/gene/TBX1. Accessed March 23, 2015.
3. Encyclopedia Brittanica (2015). http://www.britannica.com/EBchecked/topic/270557/homology . Accessed March 22, 2015.
4. Creating Phylogenic Trees from DNA Sequences. http://media.hhmi.org/biointeractive/click/Phylogenetic_Trees/01.html. Accessed March 23, 2015.
5. BLAST Glossary. http://www.ncbi.nlm.nih.gov/books/NBK62051/. Accessed March 23, 2015.
6. Jalview. http://www.jalview.org/help/html/calculations/tree.html. Accessed March 23, 2015.
7. EMBL-EBI Train Online (2015. https://www.ebi.ac.uk/training/online/course/introduction-protein-classification-ebi/protein-classification/what-are-protein-domains. Accessed March 24, 2015.
8. D'haeseleer, Patrik. What are DNA sequence motifs? Nature Biotechnology. 2010. 24, 423 - 425. http://www.nature.com/nbt/journal/v24/n4/full/nbt0406-423.html
9. Fabian A. Buske, Mikael Bodén, Denis C. Bauer and Timothy L. Bailey, "Assigning roles to DNA regulatory motifs using comparative genomics", Bioinformatics, 26(7), 860-866, 2010.
10. Timothy L. Bailey and Charles Elkan, "Fitting a mixture model by expectation maximization to discover motifs in biopolymers", Proceedings of the Second International Conference on Intelligent Systems for Molecular Biology, pp. 28-36, AAAI Press, Menlo Park, California, 1994. [pdf]
11. Sequence- and structure-based prediction of eukaryotic protein phosphorylation sites.Blom, N., Gammeltoft, S., and Brunak, S. Journal of Molecular Biology: 294(5): 1351-1362, 1999.
12. STRING. http://string-db.org/newstring_cgi/show_input_page.pl?UserId=f5ABvQ_l7bwX&sessionId=K2f6b0ShNu4. Accessed May 14, 2015.
13. Gstaiger, M & Ruedi Aebersold. (2009). Applying mass spectrometry-based proteomics to genetics, genomics and network biology. Nature Reviews Genetics 10, 617-627. doi:10.1038/nrg2633
14. Yale School of Medicine. http://keck.med.yale.edu/proteomics/technologies/posttransmodifications/index.aspx. Accessed May 14,2015.
